
The cost of observability often comes from instrumentation choices made one span, one label, and one log line at a time. This article discusses where the volume comes from, how cardinality and sampling affect it, and strategies to reduce costs without losing crucial evidence during an incident.
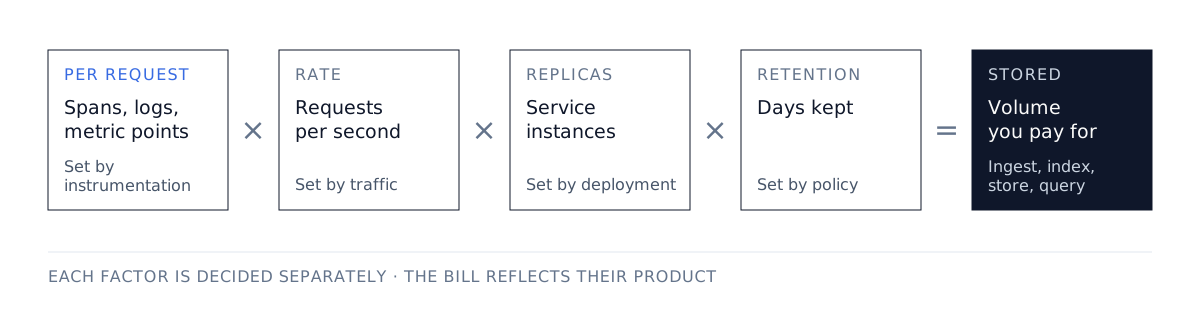
Small choices lead to infrastructure decisions
A service can emit very little data per request and still produce a large storage bill. Spans, log lines, and metric points are multiplied by request rate, replica count, and retention period. Each factor looks harmless on its own their product is what you pay for.
Growth is not only a matter of bytes. Each new metric dimension can multiply the number of series. Each new indexed field adds storage and query work. The question to ask of every additional record is how does it improve your ability to operate the service?
Costs vary by signal
Costs follow the shape of each signal, so inventory them signal by signal.
| Signal | What drives cost | Typical blind spot |
|---|---|---|
| Logs | Ingestion, indexing, retention | Verbose payloads and debug lines left on |
| Traces | Span count, attributes per span | Repeated low-value internal spans |
| Metrics | Active time series, sample frequency | Unbounded label values |
A billing dashboard alone cannot tell you whether growth came from more traffic, a new debug statement or an unbounded label shipped in the latest release. Build the inventory around signals and workloads, so each increase can be traced back to a change.
Cardinality multiplies
A metric series is identified by its full set of dimension values. When several dimensions vary independently, the number of series is the product of their distinct values. Tenant identifiers, request identifiers, and raw URLs are common sources of an explosion in the number of series.
| Attribute | Typical use | Main concern |
|---|---|---|
| HTTP method | Aggregate metric dimension | Usually bounded |
| Route template | Endpoint latency grouping | Keep templates stable |
| Request identifier | Trace or log lookup | Unbounded metric series |
| Customer email | Rarely appropriate in telemetry | Privacy and cardinality |
Take one HTTP latency metric with 5 methods, 40 route templates, 5 status classes, and 20 pods: 5 × 40 × 5 × 20 = 20,000 series. Add a request identifier and every request creates a new series, at 100 requests per second, that is 100 × 86,400 = 8,640,000 new series per day.
Note: This represents distinct series created over a day, not necessarily concurrently active series. Billing depends on the backend's handling of series churn and ingestion.
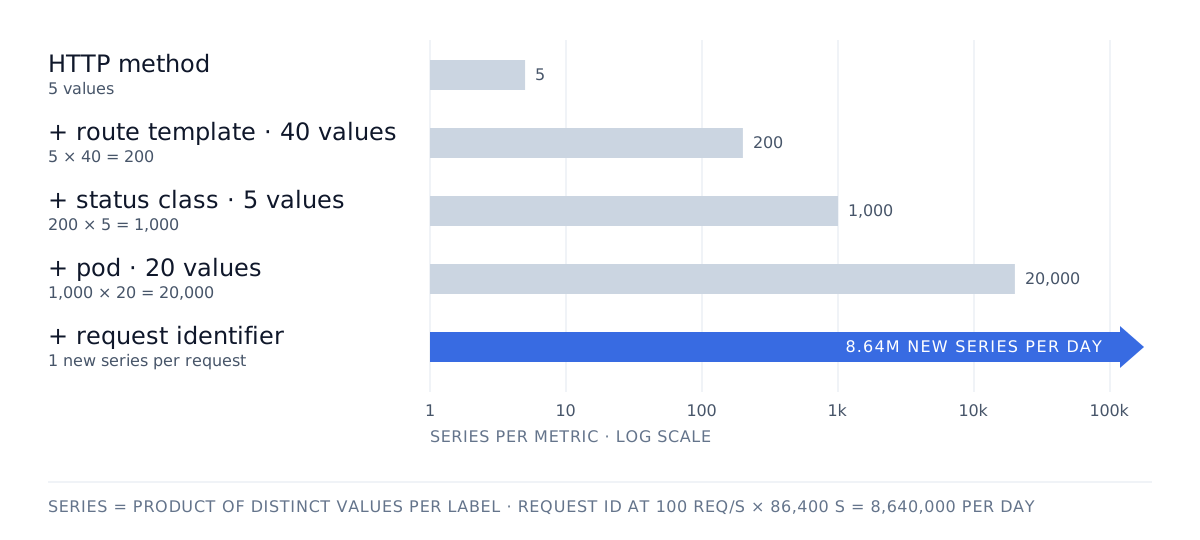
Aggregate HTTP metrics on route templates such as /orders/{id}, never on raw paths. Identifiers needed for individual investigations belong in a signal and a backend built for them, typically traces or logs. The OpenTelemetry metrics data model describes how metric identity and aggregation work.
When request identifiers are already attached to metric data points, the OpenTelemetry Collector can remove them before export:
processors:
  transform/drop_request_id:
    error_mode: ignore
    metric_statements:
      - context: datapoint
        statements:
          - delete_key(attributes, "request_id")
This removes the attribute before backend ingestion, but it does not undo cardinality or aggregation work already performed by the SDK. Avoiding unbounded attributes during instrumentation is preferable.
Sampling strategies
Head sampling decides at the start of a request whether to collect data or not. It limits work and export volume close to the source. A random policy gives broad coverage, but it can discard rare failures that only become visible later in the request.
Tail sampling decides once enough of the trace has been collected to evaluate a policy. It can keep errors and slow requests, at the price of buffering, trace-aware routing, and decision latency in the collector tier. It cannot recover spans already dropped upstream, so the two stages must be designed together.
Tail sampling reduces the volume sent to storage, but does not necessarily reduce instrumentation or collection costs. Collectors still need enough memory and processing capacity to receive and evaluate traces before discarding them.
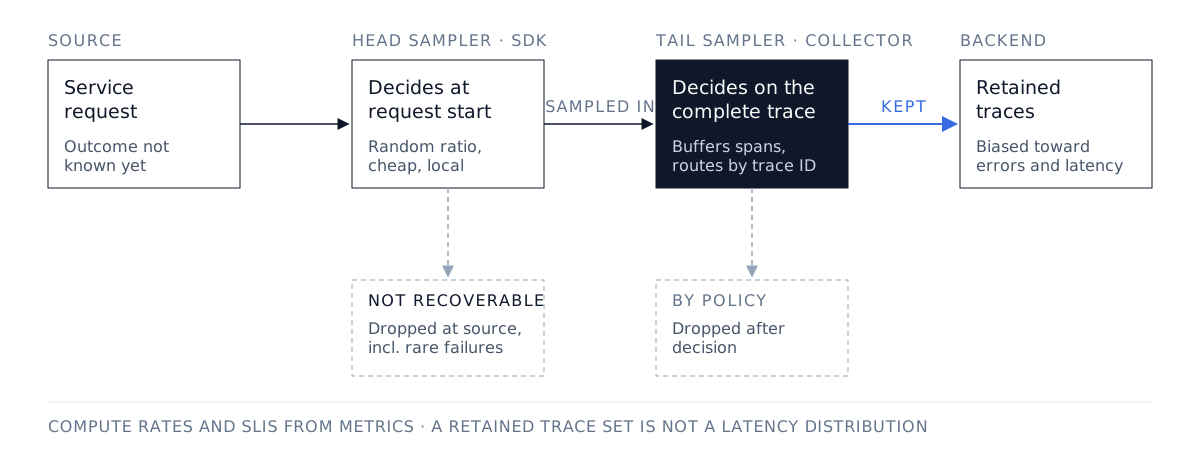
A retained set biased toward errors is useful for debugging, but it is not a representative latency distribution. Compute rates and service-level indicators from measurements collected for that purpose, usually metrics. The OpenTelemetry sampling guide discusses these trade-offs.
Retention policies should be question-driven
Different questions need different time horizons. Recent traces support detailed incident investigation. Aggregated metrics support capacity planning over longer periods. Audit events often carry their own regulatory requirements, separate from ordinary debug logs. Define retention by purpose, then verify how the backend actually deletes data. Time-based policies often run asynchronously. An expiry setting is not a guarantee that every byte disappears the instant its timestamp crosses the threshold.
Filter Early, Aggregate to the Questions You Actually Ask:
- Remove attributes that have no investigative value.
- Drop predictable noise before export or indexing, where it is most expensive.
- Aggregate measurements at the granularity your operational questions use.
- Keep a documented path to raise detail temporarily during a focused investigation.
A pipeline change can silently change what a dashboard means. Review transformations alongside instrumentation changes, and keep enough provenance to know which policy produced a given dataset.
A cost reduction succeeds only if the remaining data still supports the investigations you need. Track the indicators that show whether it does:
- Context propagation coverage across services.
- Export failures and dropped data in the pipeline.
- Telemetry missing resource identity (service, version, environment).
- Availability of relevant traces for known incidents.
Then test it directly. Inject a controlled failure and ask an engineer to find the affected operation, identify the dependency, and explain the error. That exercise measures usefulness far better than a drop in stored volume.
Balance cost against investigative value
Start with the largest contributors in your inventory. Replace an unbounded metric label, remove redundant log payloads, collapse repeated low-value spans. Measure the effect of each change on its own before adjusting sampling and retention together by changing both at once hides which one removed the evidence.
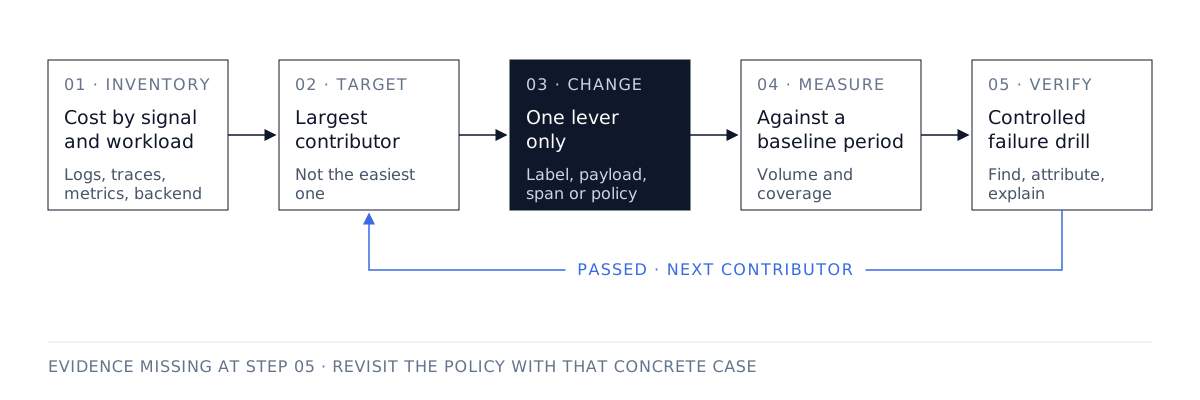
Keep a short comparison period where you can. If a policy removes evidence needed for an investigation, revisit it with that concrete case, not with a general preference for more data.
Explicit Budgets, Explicit Investigative Goals: A sustainable observability system states both what it may cost and what it must be able to explain. The work is to manage the relationship between the two enough context to explain the behavior that matters, at a delivery and storage cost the platform can sustain.