
Most teams start observability the same way. Logs go to one tool, metrics to another, and traces maybe to a third. That works well, as long as the only people looking are engineers.
Then a customer asks a simple question. Did my data arrive last night? Why did 40 events fail at 3 a.m.? Suddenly you need the same telemetry you use internally, but filtered per tenant, stripped of anything sensitive, fast enough to power a dashboard and kept for months instead of days. We run a data pipeline that receives events from an upstream SaaS provider and delivers them into each customer's own system. When a delivery fails because of expired credentials, a firewall rule or a schema change on their side, the customer needs to know before they open a ticket. Our internal logs knew. The customer did not.
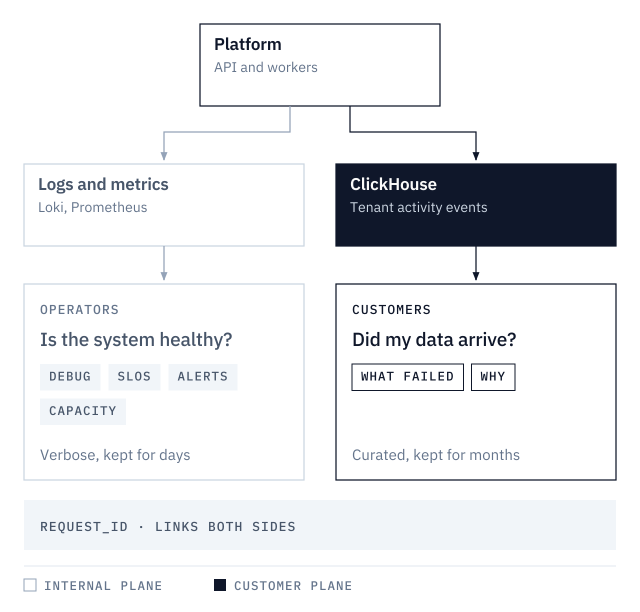
This post explains how we used ClickHouse as the storage layer for two very different audiences, our own operators and our customers. One analytical engine can serve both, as long as the two data flows never get mixed.
Why ClickHouse
Observability data has a very particular shape, and it happens to be the shape ClickHouse was built for.
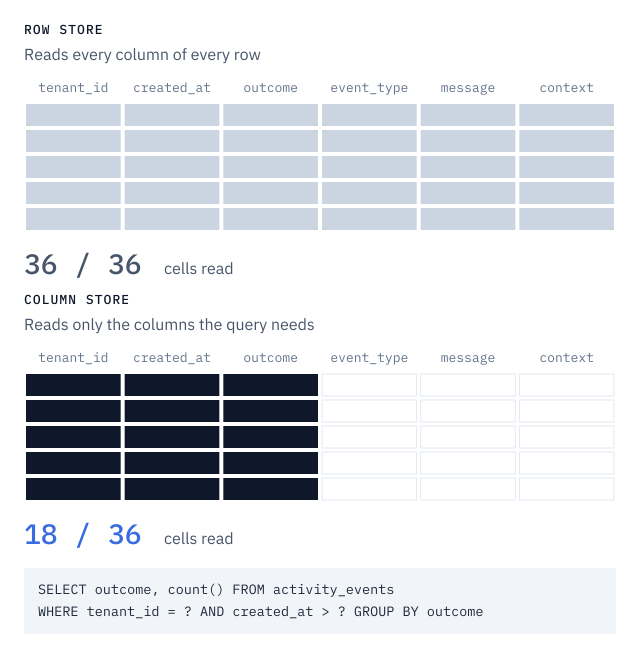
It is written once and never updated. It is read mostly in aggregate, with questions like "how many failures per hour for this tenant?". And it is almost always filtered by time. A row store reads entire rows to answer a question about two columns. ClickHouse stores each column separately, so a query that counts failures by outcome only reads tenant_id, created_at and outcome, which is a small fraction of the data on disk.
Writes are cheap too. Each insert creates an immutable "part", and background merges combine these parts later. This stays fast and predictable as long as you follow the one rule that matters, which is to insert in batches and never row by row.
Then there is compression. Telemetry is extremely repetitive, with the same twenty event types, four outcome values and a handful of services again and again. Types like LowCardinality(String) encode these columns with a dictionary, and sorted storage puts similar values next to each other, so standard codecs squeeze them very well. Ratios of 10x or more on log-like data are common. On top of that, ClickHouse ships the building blocks observability needs out of the box, from TTL-based retention and materialized views to rollup engines like SummingMergeTree and AggregatingMergeTree, and time-series helpers like WITH FILL.
It does not replace everything, though. Prometheus is still better at real-time alerting on metrics. Loki is cheaper for searching raw application logs that nobody will aggregate. A dedicated tracing backend gives you trace waterfalls for free. Our rule of thumb is to send operator telemetry that needs alerting within seconds to Prometheus, keep raw debug logs in a log store, and put anything scoped to a tenant, aggregated, kept for months or shown to customers in ClickHouse.
You do not have to move everything on day one. Start with what benefits from SQL.
Two audiences, two flows
Internal observability answers operator questions. Is the webhook endpoint meeting its latency SLO? Is the queue backing up? Which dependency is down? That data is verbose, technical and short-lived, and it may contain stack traces and internal hostnames. Customer-facing observability answers a different set of questions, like did my events arrive, what failed, and why. That data is a product surface, not a debug dump. Every row belongs to exactly one tenant, every message is written for a human, and failure reasons come from a closed list the customer can act on, such as "authentication failed", "connection refused" or "table missing".
It is tempting to log once and show customers a filtered view of internal logs. Don't. An internal log line says pool acquire timeout after 5000ms on host 10.0.3.12. The customer event for the same problem says CONNECTION_FAILED, followed by a plain sentence telling them we could not reach their database and that their firewall should allow our IP range. Same incident, two different messages, so we emit them separately and on purpose.
Two more rules made this hold. Severity follows the fault domain, so bad credentials or an unreachable database on the customer side are warnings for us and alerts for them, while failures on our side are errors that should page someone. And no customer payload ever goes into telemetry. Activity events carry IDs, counts, statuses and durations, nothing more.
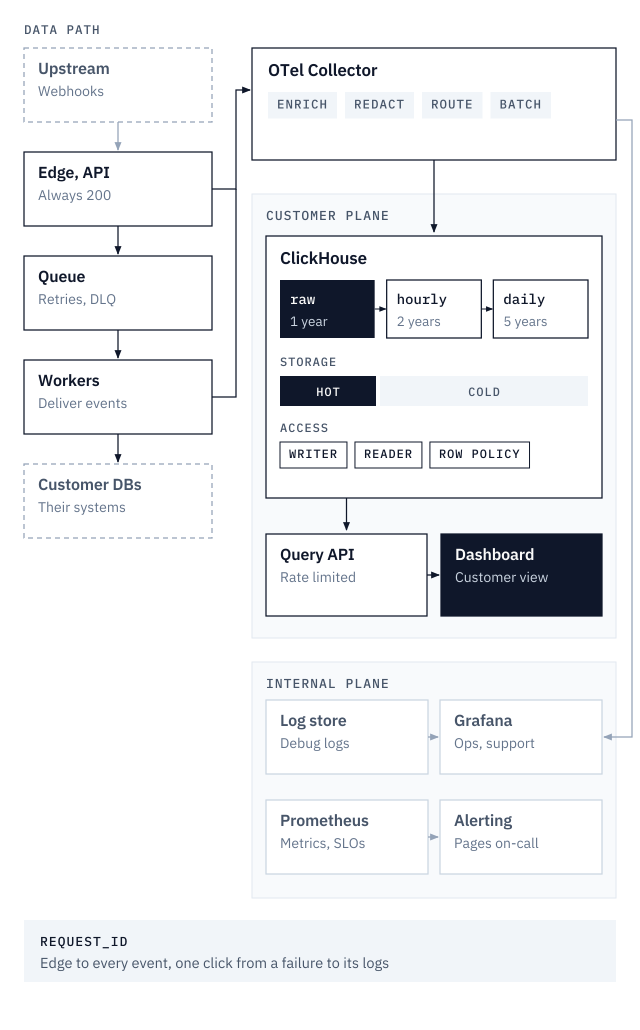
The bridge between the two worlds is a correlation ID. It is created at the HTTP edge, carried through the queue headers into the workers, and stored on every customer event. When support sees a failed event in the admin UI, one click takes them to the matching internal logs.
| Internal | Customer-facing | |
|---|---|---|
| Audience | Engineers, alert rules | Tenants and support |
| Main question | Is the system healthy? | Did my data arrive? |
| Content | Technical, verbose | Curated, actionable |
| Sensitivity | Internal details are fine | No payload, no internals |
| Retention | Days to weeks | Months to years |
| Latency need | Seconds, for alerting | Seconds to minutes, for dashboards |
| Storage | Metrics and log store | ClickHouse |
A data model built around the queries
In ClickHouse, the ORDER BY clause is your index, so you choose it from the queries you will run and not from the shape of the entity. Every telemetry row carries the same envelope, whatever its kind, with tenant_id, service, environment, a timestamp and a correlation ID. Those are the dimensions every query filters on.
CREATE TABLE activity_events
(
    id                UUID,
    tenant_id         UUID,
    created_at        DateTime64(3, 'UTC'),
    service           LowCardinality(String),
    environment       LowCardinality(String),
    event_type        LowCardinality(String),
    outcome           LowCardinality(String),   -- succeeded | failed | warning | info
    failure_category  LowCardinality(String),   -- closed vocabulary
    message           String,
    context           String,                   -- JSON, metadata only
    latency_ms        UInt32,
    request_id        String
)
ENGINE = MergeTree
PARTITION BY toYYYYMM(created_at)
ORDER BY (tenant_id, created_at, event_type)
TTL toDateTime(created_at) + INTERVAL 1 YEAR
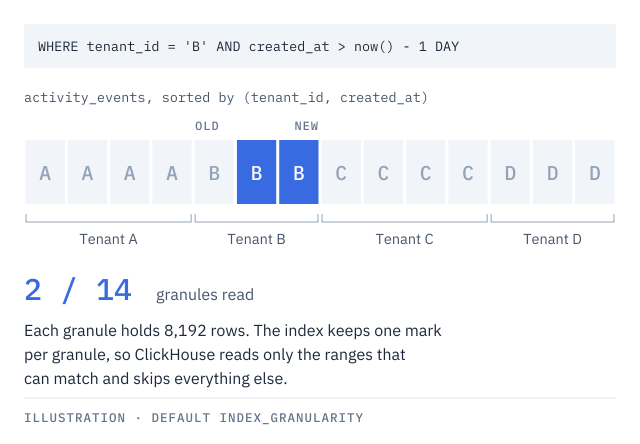
Three choices in this table do most of the work. Putting tenant_id first in the sort key means ClickHouse skips every granule that belongs to other tenants, which matters because every customer query filters by tenant. It is also the base of tenant isolation. Monthly partitions are coarse enough to avoid thousands of parts and fine enough to let TTL drop whole partitions cheaply. And outcome and failure_category take values from a closed list, because free-text statuses are impossible to aggregate. Decide that list early. We renamed ours once, from status to outcome and from error to failed, and backfilling a year of data was not fun.
Traces follow the same idea, with heavier rows and a shorter life.
CREATE TABLE spans
(
    tenant_id       UUID,
    trace_id        FixedString(16),
    span_id         FixedString(8),
    parent_span_id  FixedString(8),
    service         LowCardinality(String),
    name            LowCardinality(String),
    start_time      DateTime64(9, 'UTC'),
    duration_ns     UInt64,
    status          LowCardinality(String),
    attributes      Map(LowCardinality(String), String)
)
ENGINE = MergeTree
PARTITION BY toDate(start_time)
ORDER BY (tenant_id, service, start_time)
TTL toDateTime(start_time) + INTERVAL 14 DAY
Add a bloom_filter index on trace_id so that "show me this trace" does not scan a full day of spans. Customers rarely need full waterfalls. A summary like "delivery took 340 ms, with 20 ms in the queue and 300 ms in your database" is usually enough.
Metrics come in two kinds. Derived metrics, like failure rate or p95 latency per tenant, are computed from events and come for free through materialized views. Native gauges and counters are stored as (tenant_id, metric_name, timestamp, value) with LowCardinality names. Most customer-facing metrics should be derived, because if you can compute it from events there is no reason to emit it twice. The same append-only thinking works for some stateful features too. Customer notifications go from created to seen to dismissed, and we store each step as an event, with the current state given by argMax(action, at) per notification. No updates, no mutations, and the full history for free.
Getting data in without slowing anything down
The goal is to decouple the moment an event is produced from the moment it is written. Applications should not know where telemetry is stored. They send OTLP to a local OpenTelemetry Collector, and the collector decides where each signal goes, which gives you one place to change routing, add a destination or drop a field without redeploying every service.
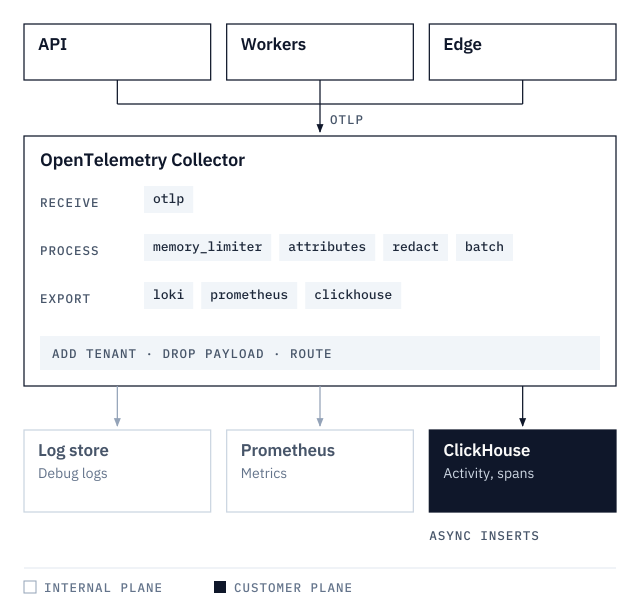
The collector is also where the rules from the previous section are enforced. It attaches tenant_id, environment and service from resource attributes. It drops any attribute that is not on an allowlist before the event goes to a table customers can see, and we use an allowlist rather than a denylist so that new fields are private by default. Then it routes internal signals to the internal stack and customer activity to ClickHouse.
The most common ClickHouse mistake is inserting one row per event. Each insert creates a part, thousands of tiny parts per second overwhelm the merges, and sooner or later you hit the "Too many parts" error. You can fix it on the client side by buffering in the collector, or in a bounded in-process queue, and flushing every N rows or every T seconds, whichever comes first. Or you can let the server do it with async_insert = 1, which buffers small inserts and flushes them together, adding wait_for_async_insert = 1 if you need a delivery acknowledgment.
Whatever you choose, the buffer must be bounded. When ClickHouse is slow, telemetry should drop events and increase a counter you alert on. It should never block the pipeline that does the real work, because customer activity matters but not more than delivering the customer's data.
Keep the write path boring. A dedicated writer user with INSERT rights only, schema migrations versioned and checksummed like any other database, and the event pipeline itself, with its queue, retries and dead-letter queue, living upstream. Activity events simply describe what happens in that pipeline, so they are emitted at each decision point.
Keeping tenants apart
One table per tenant looks attractive for isolation, but it scales badly. Every tenant multiplies parts, merges and migrations, and with thousands of tenants ClickHouse spends its time merging tiny tables. Shared tables with tenant_id first in the sort key give almost the same query speed per tenant, with a single schema to evolve. We keep dedicated tables or clusters for the rare tenant with a very different volume, or a contract that requires physical isolation.
| Shared tables | Dedicated tables | |
|---|---|---|
| Parts and merges | Few, large | Many, small |
| Migrations | One schema | One per tenant |
| Isolation | Logical, by key and policy | Physical |
| Noisy neighbors | Handled with quotas | Less exposed |
| Cost | Low | Grows with tenant count |
Scoping starts in the application. The API looks up which tenants the signed-in user can access in the primary database, then always binds tenant_id as a query parameter and never pastes it into the SQL string. What customers see is a product decision too. By default they get failures, warnings and key milestones like "connection verified", not every successful event, which would bury the signal. A debug mode limited to 7 days shows everything while they troubleshoot.
Inside ClickHouse we add a second layer. Each role gets its own user, with a writer that can only INSERT, a reader that can only SELECT on customer tables, a migrator for DDL and a read-only analyst for internal work. A row policy then acts as a second lock. The API sets a custom setting on each query, so even a bug that forgets the WHERE clause cannot leak another tenant's rows. Network policies make sure only the services that need ClickHouse can reach it.
CREATE ROW POLICY tenant_isolation ON activity_events
USING tenant_id = getSetting('SQL_tenant_id')
TO reader
The last risk is a noisy neighbor inside your own company. Customer dashboards, support tools and batch rollups share the same server, and one heavy internal query can slow every dashboard. Settings profiles per user cap max_execution_time, max_memory_usage, max_rows_to_read and max_threads, quotas limit queries and rows read over a time window, and workload scheduling in recent versions gives customer reads priority over internal analytics and cron jobs.
Retention and rollups
We keep raw detail for a short time and aggregates for a long time. As data gets older, it changes shape. Retention itself is declarative, with TTL created_at + INTERVAL 1 YEAR on the raw table and longer values on the aggregates. Since partitions are monthly, expiry usually drops whole partitions, which costs almost nothing, and ttl_only_drop_parts = 1 makes that behavior explicit.
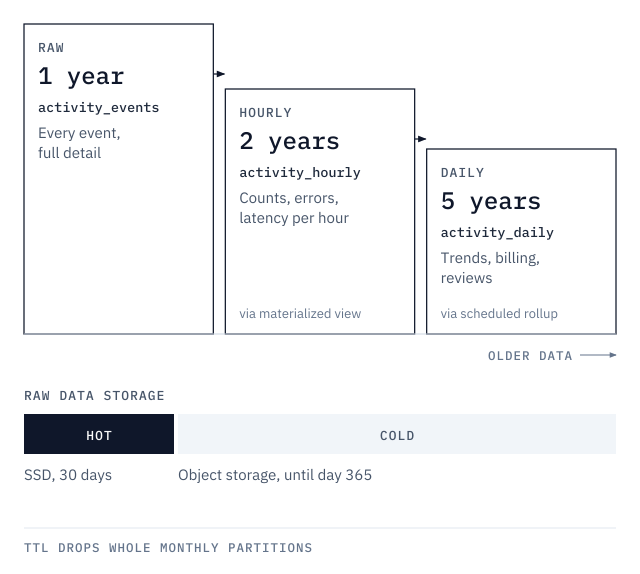
The step from raw to hourly is a materialized view.
CREATE MATERIALIZED VIEW activity_hourly_mv TO activity_hourly AS
SELECT
    tenant_id,
    toStartOfHour(created_at)        AS hour,
    event_type,
    outcome,
    count()                          AS event_count,
    countIf(outcome = 'failed')      AS error_count,
    sum(latency_ms)                  AS latency_ms_sum,
    max(latency_ms)                  AS latency_ms_max
FROM activity_events
GROUP BY tenant_id, hour, event_type, outcome
In ClickHouse a materialized view works like an insert trigger. Each batch written to the raw table is aggregated and appended to the target table, so customer dashboards read thousands of hourly rows instead of millions of raw events. The target table uses SummingMergeTree, which sums the numeric columns of rows sharing the same key during merges. That is perfect for counts and sums, and wrong for averages. We learned it the hard way when an avg_latency column got summed after a rollup ran twice, and the "average" quietly doubled.
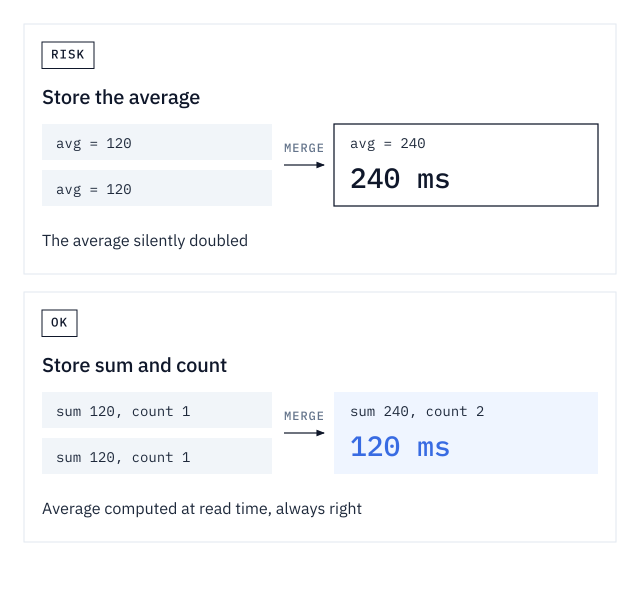
So we now store sums and counts and compute averages at read time, with latency_ms_sum / event_count. Max and min use SimpleAggregateFunction(max, …). Percentiles and unique counts go into an AggregatingMergeTree with quantileState or uniqState and the -Merge combinators. Reads always go through sum() and GROUP BY, because merges happen eventually and not instantly. And every scheduled rollup is idempotent, deleting its target window before inserting again.
Storage follows the same logic. Recent data is queried all the time, while last year's data is mostly opened at the end of the month, so a storage policy with two volumes moves parts as they age. The cold volume sits on S3-compatible object storage with a local cache, and queries stay exactly the same.
TTL toDateTime(created_at) + INTERVAL 30 DAY TO VOLUME 'cold',
    toDateTime(created_at) + INTERVAL 1 YEAR DELETE
A few smaller levers help too, like Delta with ZSTD codecs for timestamps and counters, a tokenbf_v1 skip index if support searches free text in messages, and projections when one access pattern does not fit the main sort key. Measure first, with system.parts and system.query_log.
Serving customers, and the whole picture
We do not expose SQL. The API offers a handful of purpose-built endpoints, each mapped to one bounded query. GET /activity returns the latest failures and milestones with cursor pagination, GET /insights gives a 24-hour summary, GET /metrics?range=day|week|month serves time series from the hourly rollup, and GET /events/stream pushes server-sent events to the live dashboard.
The rule behind them is simple. Customer endpoints read rollups, and only support tools read raw events. Pagination uses a cursor on (created_at, id) and never OFFSET, which gets slower with every page. And the sort-key column is never wrapped in a function inside a WHERE clause, like toUnixTimestamp(created_at) > ?, because comparing the column directly is what lets the index work.
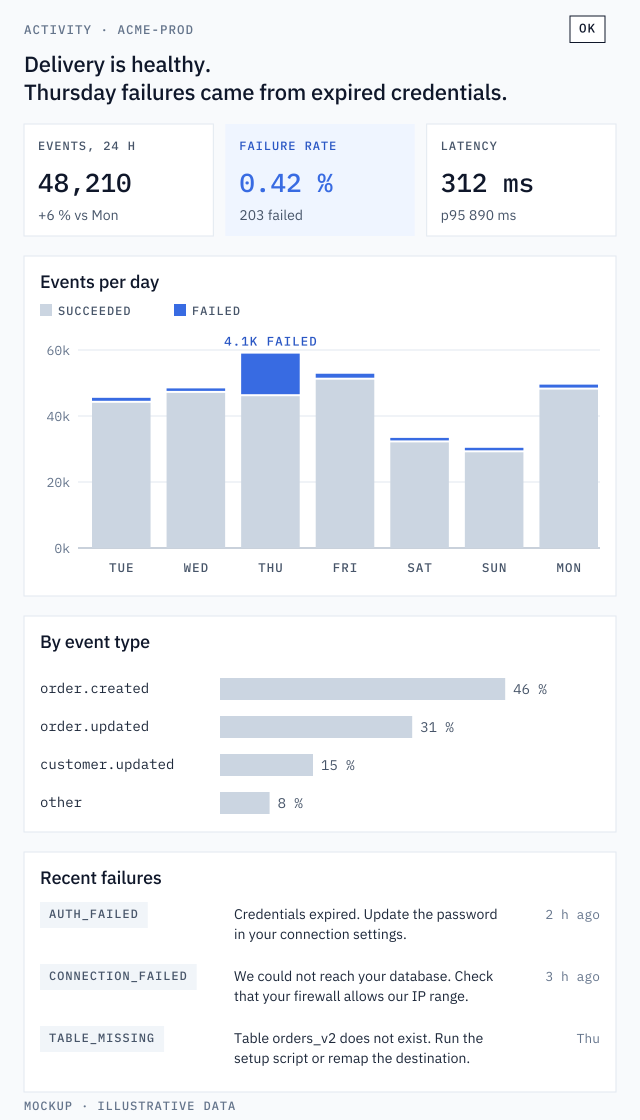
The customer dashboard mirrors those endpoints. It shows a health summary, events against failures over time, a breakdown by event type, and a feed of recent failures with messages the customer can act on. WITH FILL keeps the series continuous, so an hour with no events shows as zero instead of a gap. Internally, the same tables feed Grafana panels for support and operations, through a ClickHouse data source and a tenant variable.
Every query has guardrails, with time windows capped at 30 days on raw data, fixed LIMIT values, an API rate limit per tenant and the ClickHouse settings profile as a backstop. For live views, push from the pipeline or poll aggregates at short intervals. Polling raw tables from thousands of open dashboards is how you DoS yourself.
Put together, services emit telemetry once, through a collector that enriches, redacts and routes it. Operator signals go to the tools built for alerting and debugging. Customer activity lands in ClickHouse, where it is aggregated in real time, kept according to its value, isolated per tenant and served through a narrow, bounded API. A single correlation ID ties both worlds together.
| Component | Role | Why |
|---|---|---|
| OTel Collector | Enrich, redact, route, batch | Decouple apps from storage |
| Prometheus and Alertmanager | Internal metrics, SLO alerts | Real-time alerting |
| Log store | Internal debug logs | Cheap search, short retention |
| ClickHouse raw table | Tenant activity events | Columnar, compressed, TTL |
| Materialized views | Hourly aggregates | Fast dashboards |
| Scheduled rollups | Daily and weekly trends | Long retention, small footprint |
| Query API | Bounded tenant endpoints | Safety and quotas |